Back to Parent

Outcome


Problem Space & Inspiration

Inspired by the disconnect between students and educators, we created Feel-o-Meter to provide an alternate method for feedback. We noticed or have experienced that in many classrooms or work environments, some people do not feel comfortable expressing their feelings or that feedback is often shared when it’s too late.

With Feel-o-Meter, we hope to bridge that gap and share essential information with the right people, when it matters the most. 
What is Feel-o-Meter? (Concept)

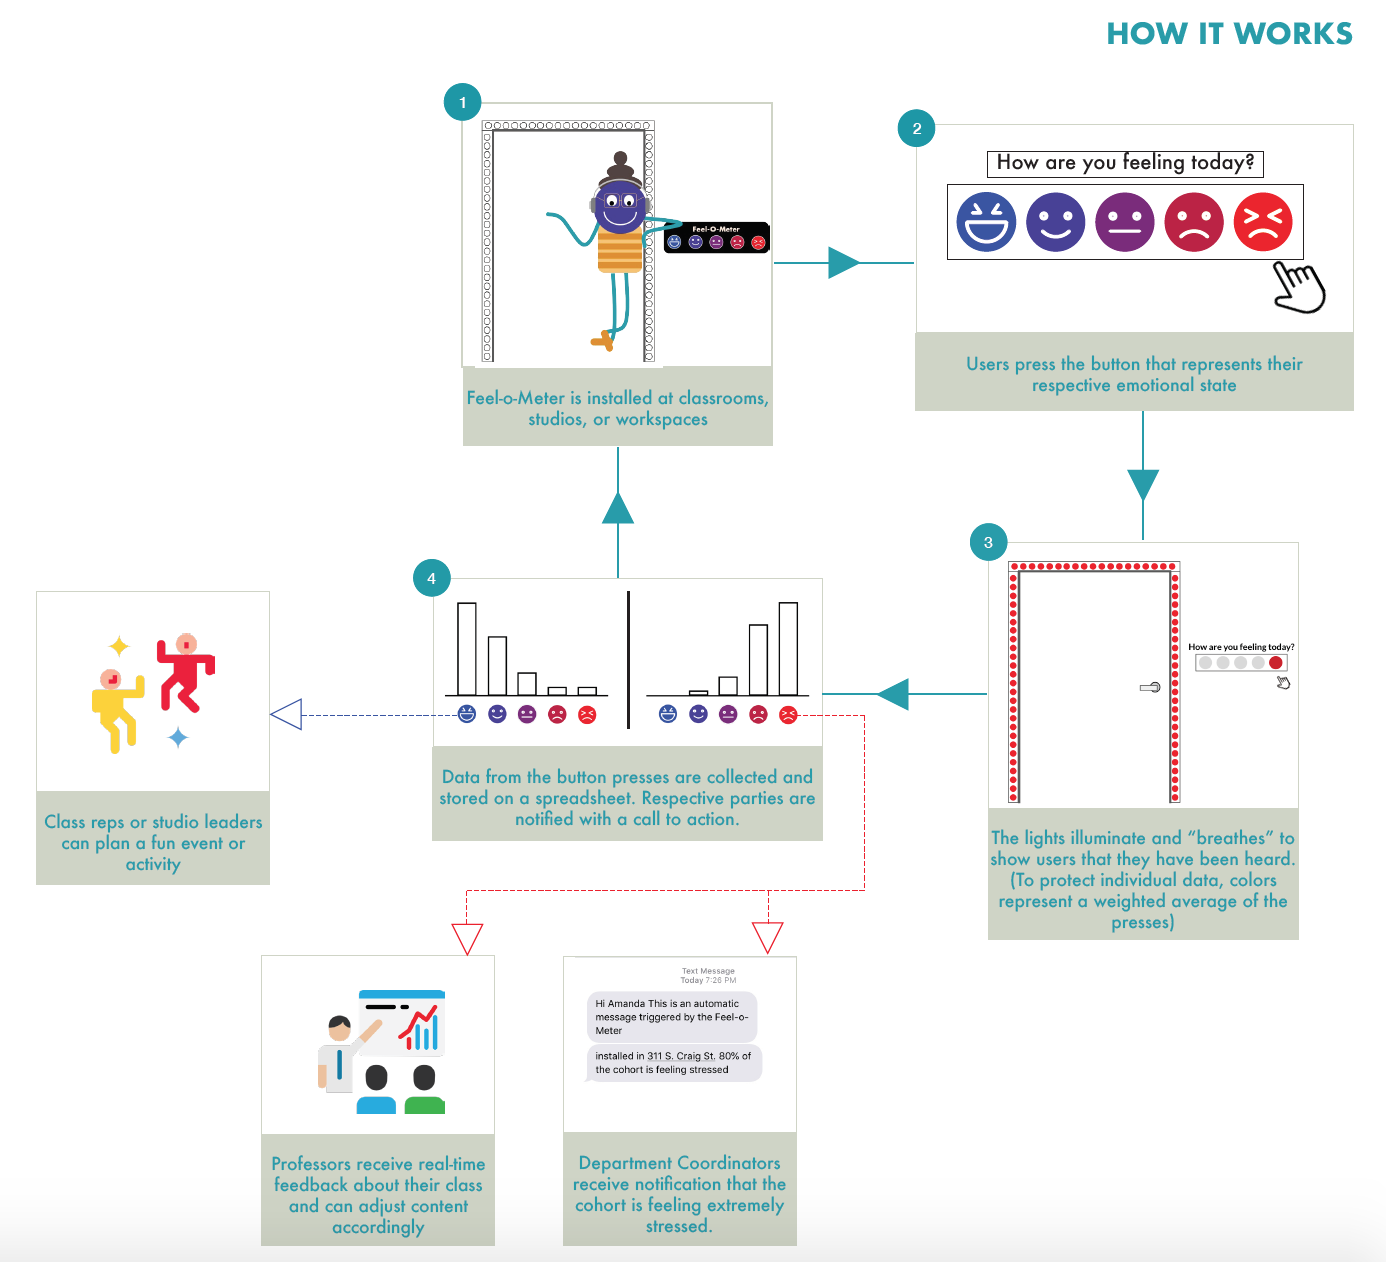
Feel-o-Meter is an interactive feedback device designed to help people express how they are feeling. This idea has proven successful by HappyOrNot (https://www.happy-or-not.com/en/) , a Finnish company that makes these customer satisfaction measurement terminals. While the mechanism is simple, it has proven the be impactful as the volume of data points is significantly higher than any other form of customer satisfaction survey.

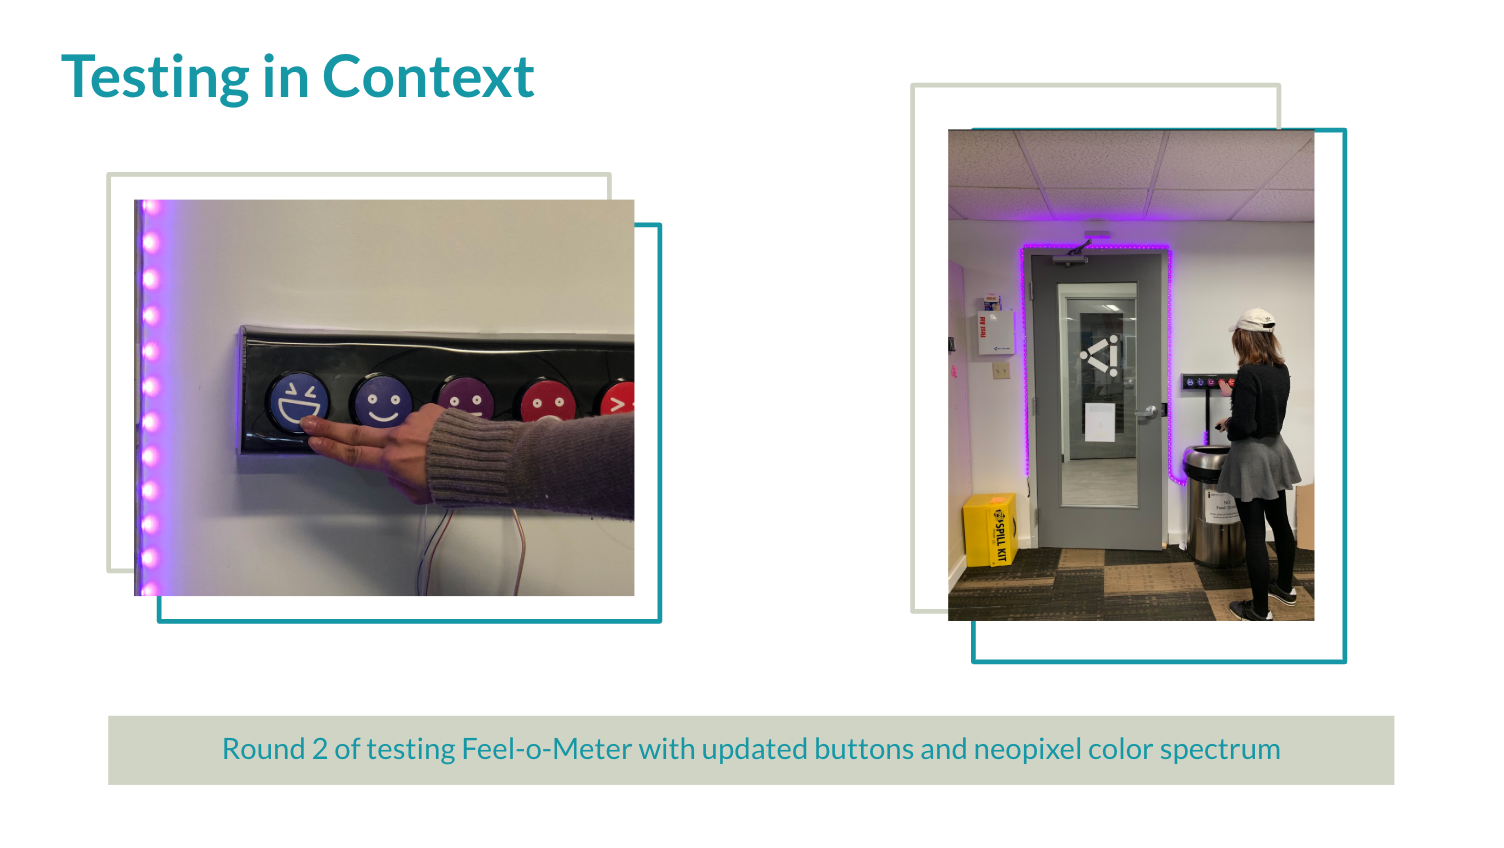
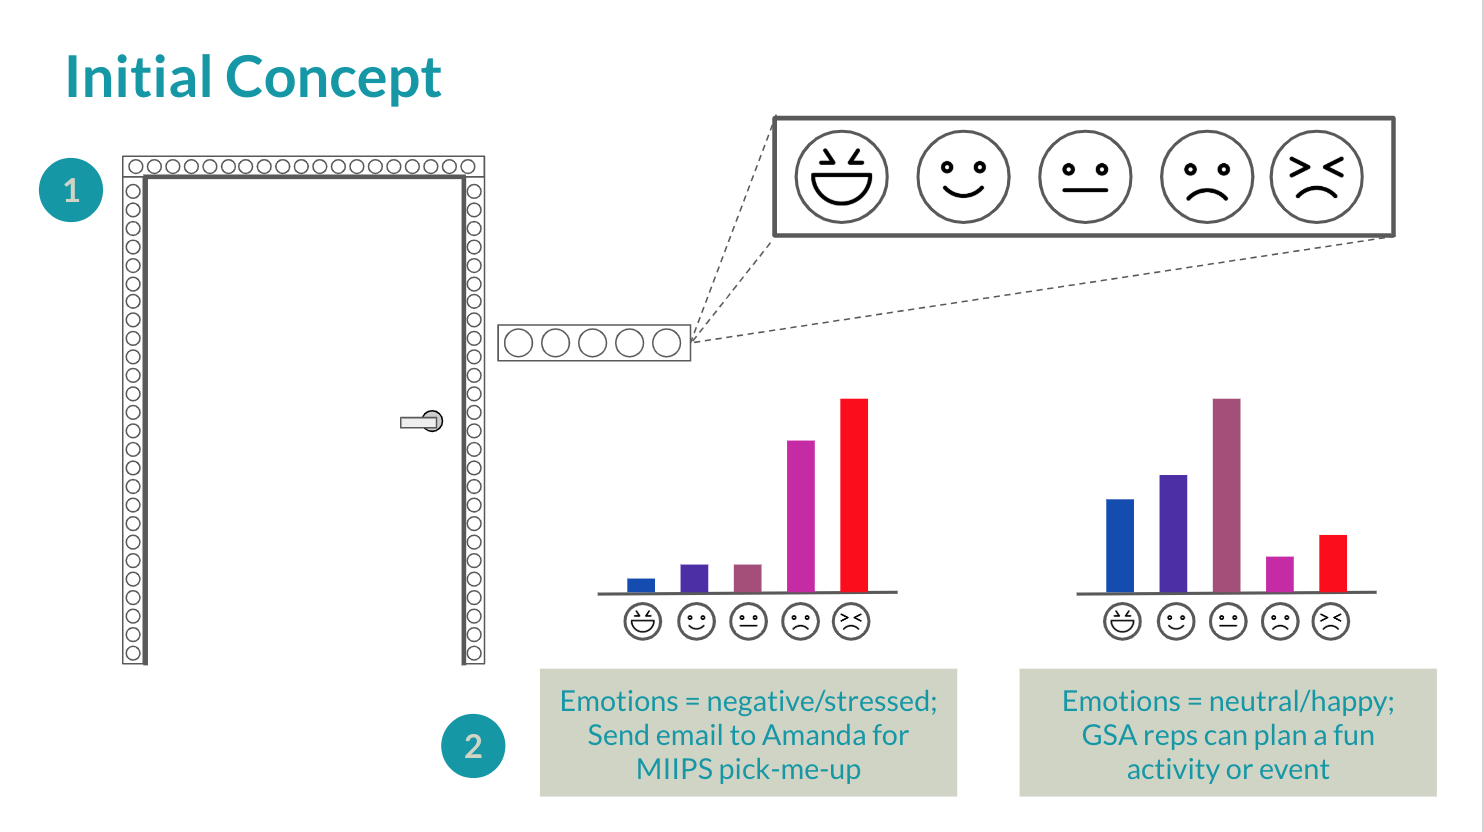
Our product has 5 buttons, each representing an emotional scale from Very Happy (Blue) to Very Sad/Frustrated (Red). The device would be installed by the exit of classrooms/studios with a neopixel strip bordering the nearby door. When a button is pressed, the lights illuminate to signal that a person’s feelings have been heard; and the color of the lights represent the average emotion of all the presses. This helps to protect an individual’s feelings, while showcasing how the group is feeling as a whole.

Give Feel-o-Meter a push, take a breath, release... and watch the lights breathe back.

Screen shot 2019 03 06 at 9.17.03 pm
Show Advanced Options
Screen shot 2019 03 07 at 5.32.04 pm
Show Advanced Options
Screen shot 2019 03 06 at 11.14.31 pm
Show Advanced Options

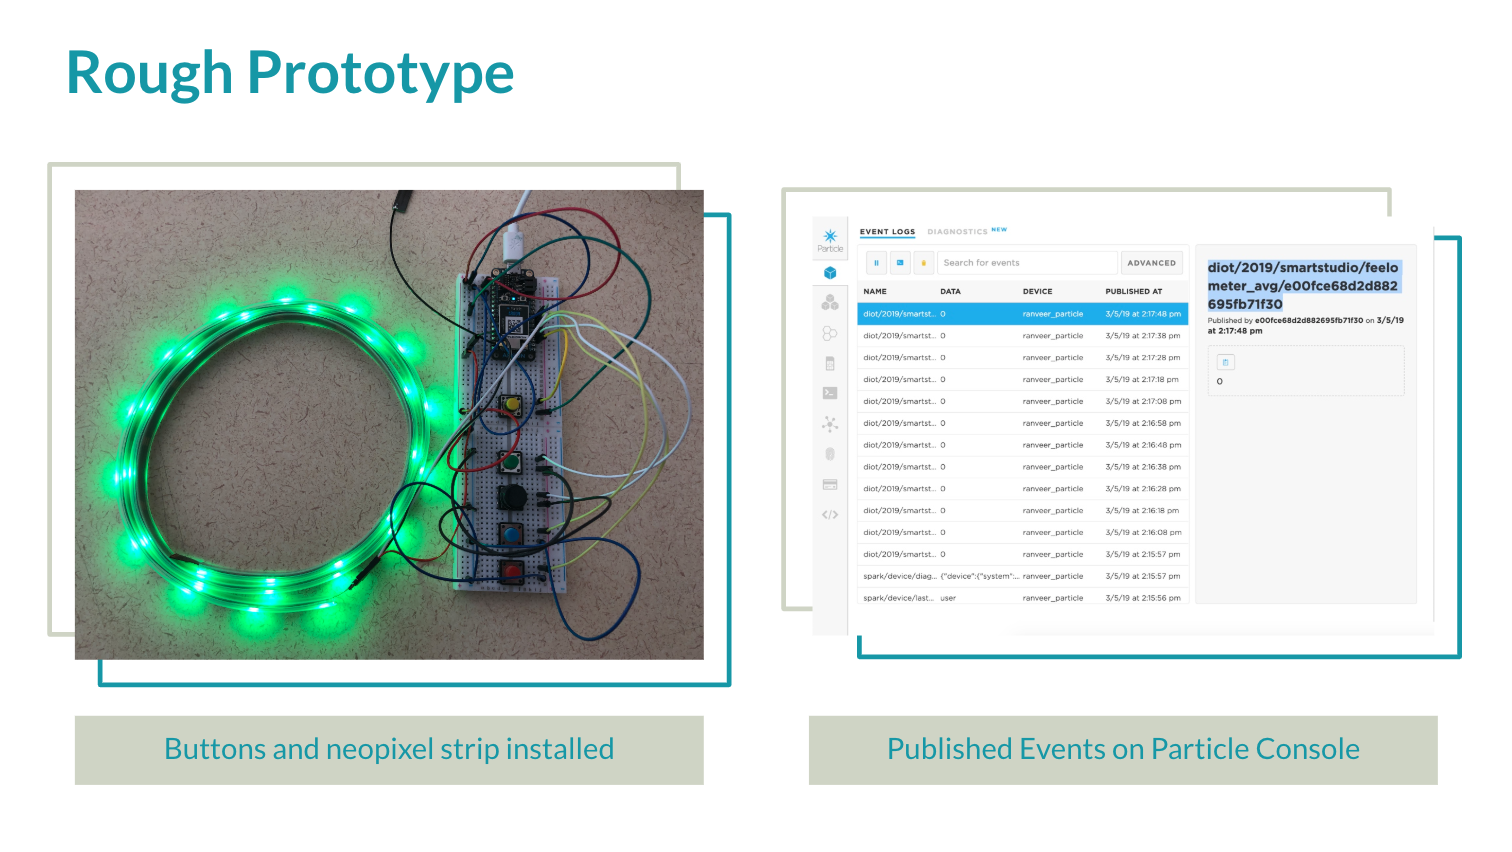
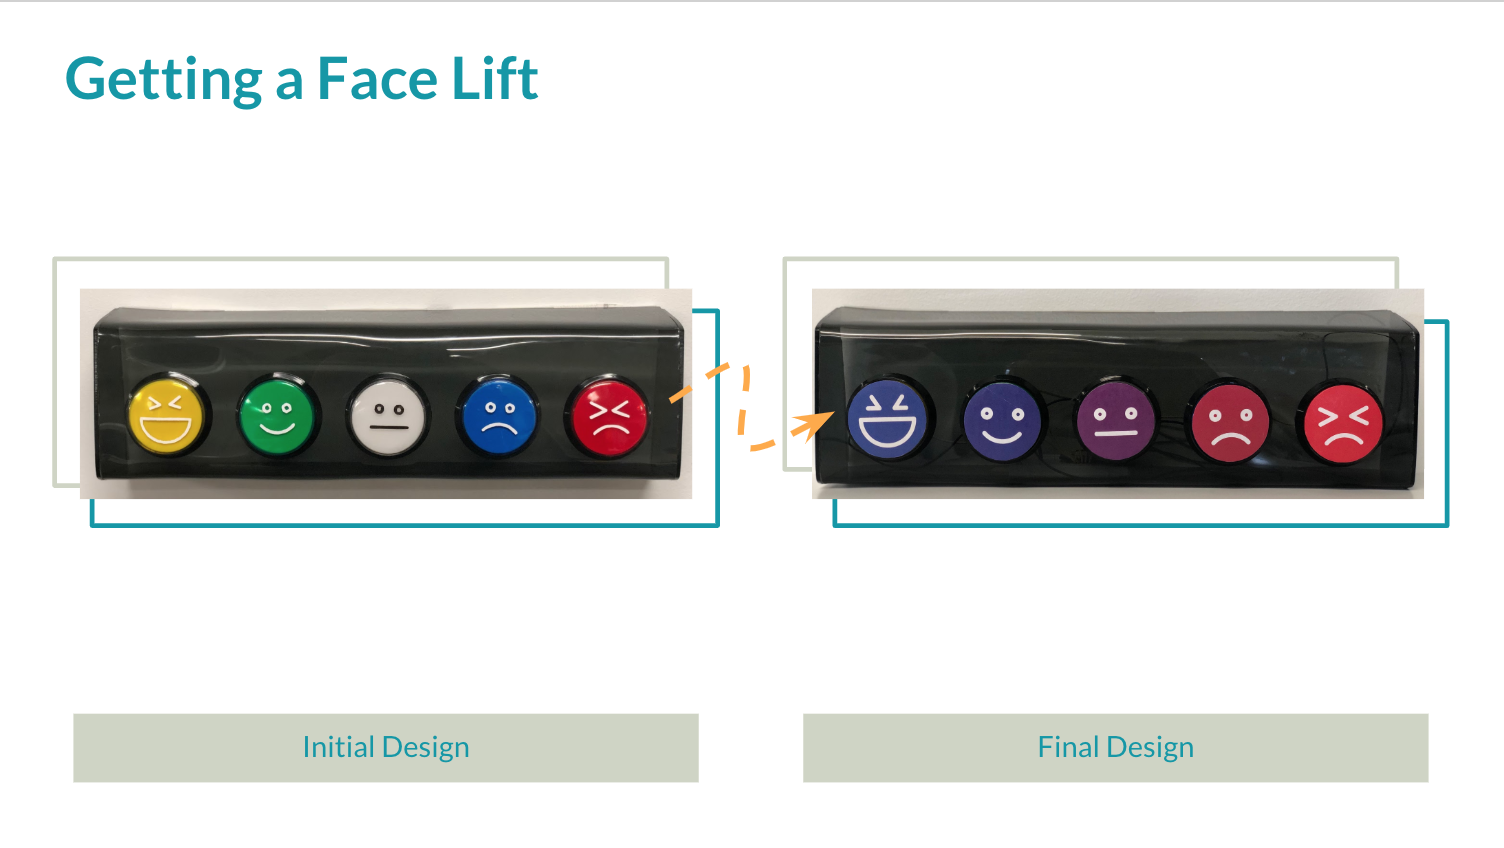
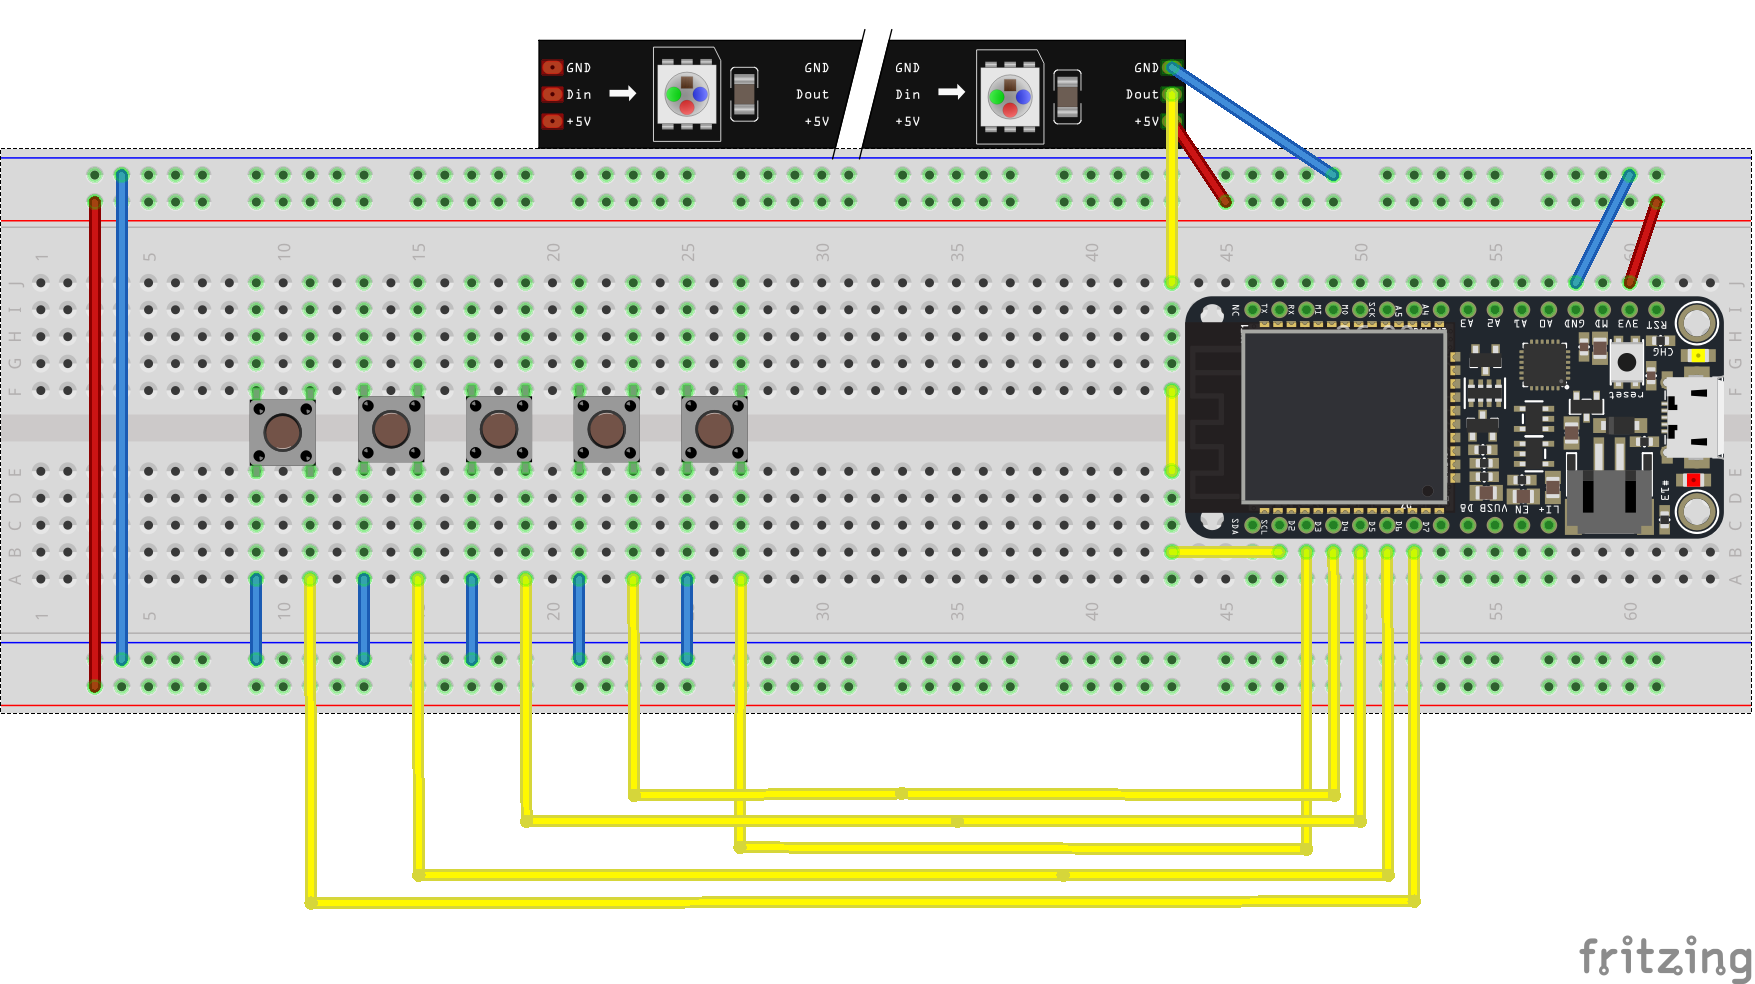
To bring our initial concept to life, our first step involved installing 5 push buttons and a neopixel strip that would illuminate with a color corresponding to the color of the push buttons. The emotional scale and color spectrum were as follows:

1. Very Happy/Excited – Yellow

2. Happy – Green

3. Neutral/"Meh" – White (note, the image above has a black button although the corresponding light was white)

4. Sad – Blue

5. Very Sad/Frustrated – Red

In addition, we used Particle.publish to share our event with other teams who were networking with us (using our outgoing data).  

Screen shot 2019 03 06 at 9.17.22 pm
Show Advanced Options

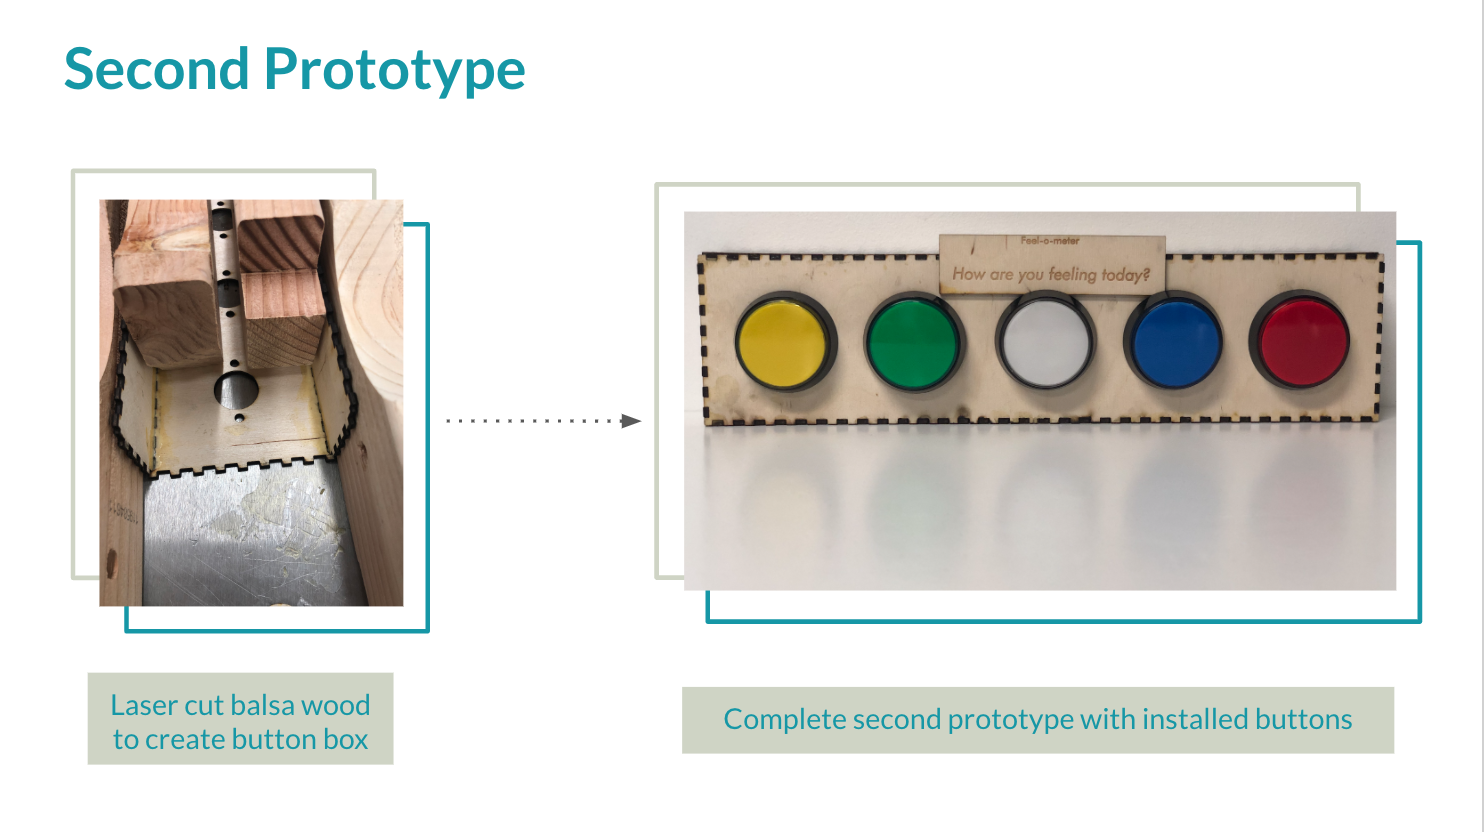
As we continued to build upon our concept, we built our first prototype by laser cutting and assembling pieces of balsa wood. We fitted and installed the arcade buttons and allowed users in the studio to provide feedback. 

Overall, it was received positively, as the prototype seemed "approachable", "friendly", and "fun to press". During this stage, we also explored the placement and spacing of the components, sizing of the button box, and discussed what "feeling" we would like to communicate through our design elements. While we liked the "cuteness" of the balsa wood, we decided to elevate our aesthetic by creating a new button box with acrylic. 

Screen shot 2019 03 07 at 9.50.45 am
Show Advanced Options

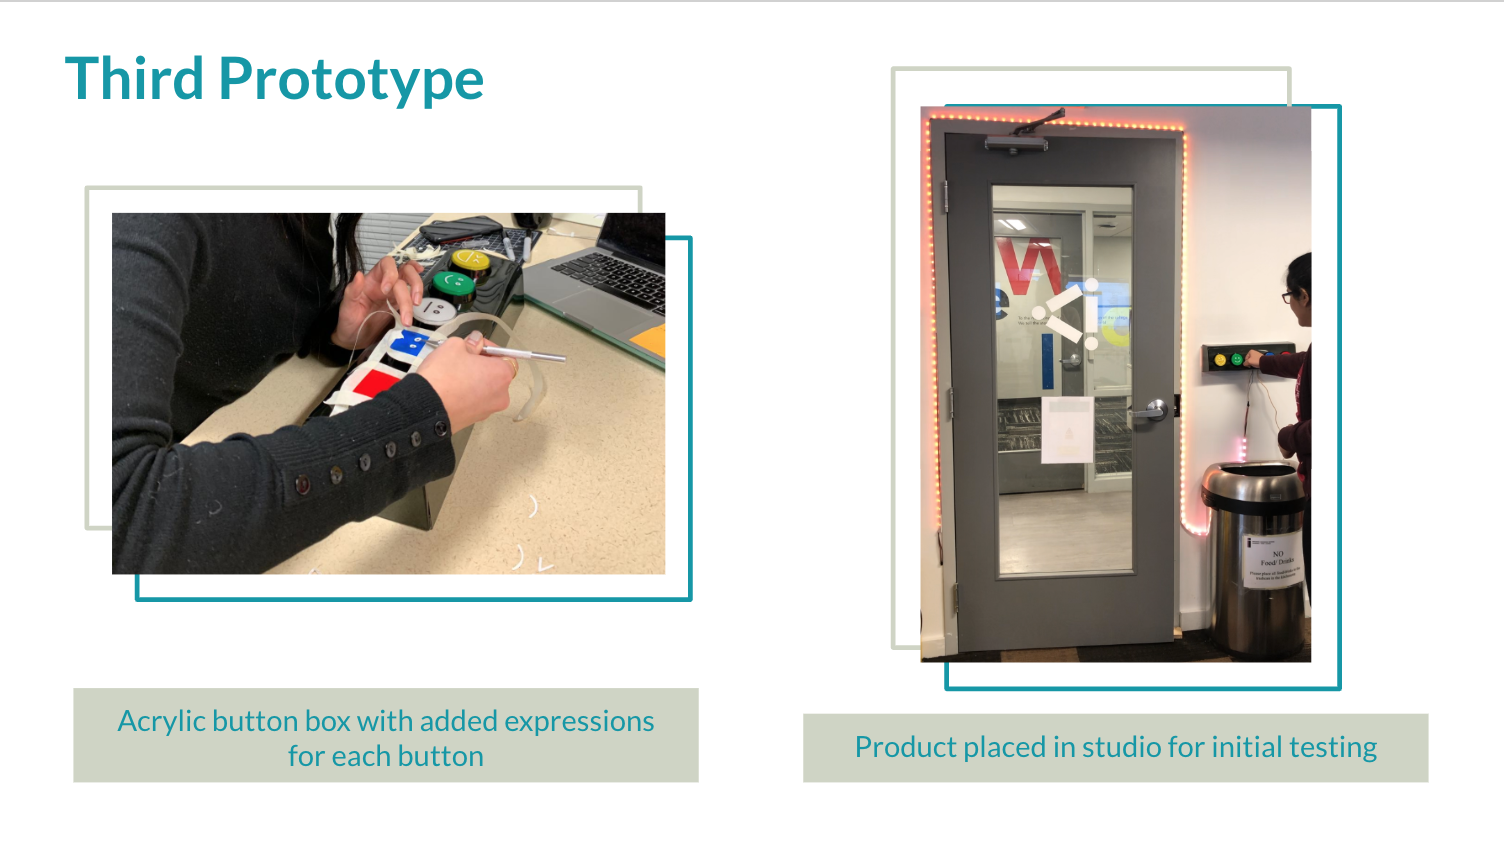
Our third prototype involved creating a new button box with black acrylic. After installing the arcade buttons, we exacto-cut the emoji expressions to show users which buttons/colors represented respective emotions. 

Screen shot 2019 03 07 at 10.04.11 am
Show Advanced Options

During this step, we decided to give Feel-o-Meter a "makeover". While we were originally using a step function to produce matching colors for our initial design (yellow, green, white, blue, and red), we decided to switch to a smoother color equation. This allowed us to produce a more ambient product, with a gradient from blue to red (representing Very Happy to Very Sad/Frustrated).  

Screen shot 2019 03 07 at 10.50.13 am
Show Advanced Options

Network Partners

We connected with three other internet devices in the studio to provide them our data as inputs.

  • Rings of Success: They created a device to celebrate the accomplishment of a task by triggering a huge arcade button connected to a display of task performance matrix of the studio. They used the "mood color" displayed on the LEDs that reflected the average emotions of the people in the studio.
  • Silver Lining: They created a cloud shaped display to spread positive vibes in the studio. We shared the "average emotional state" of the studio with them so that they can trigger messages according to the mood of the people utilizing the studio space.
  • Harmoniiize: They created a connected instrument, which allows anyone to create music using gestures and express their creativity through musical notes. We shared the "average emotional state" of the studio with them so that they can trigger different instruments based on the mood of the people in the studio.

How Can Feel-o-Meter Help You? (Future Applications)

While similar products exist in other high traffic contexts (airports, public bathrooms, etc.), Feel-0-Meter differentiates itself from other devices by providing instant feedback to users when a button is pressed; the breathing lights around the doorway/exit comfort and confirm that their feelings are being heard. Additionally, Feel-o-Meter also triggers various calls-to-action (CTAs) tailored to specific contexts; for example, in class/studio settings, Department Coordinators receive a message when majority of the cohort is stressed.

Feel-o-Meter can be applied to other educational settings beyond universities, especially for grade levels where students may not be able to successfully articulate how they are feeling (K-12).  

Additionally, Feel-o-Meter may also be useful at offices or workspaces to track employees' feelings and engagement. 

Show Advanced Options

How We Built This


Materials Used:

1. Adafruit Arcade LED Buttons (x5)

2. Particle Argon (x1)

3. Neopixel strip, 150 pixels (x1)

4. Acrylic sheet, 24x24'' (x1)

5. Jumper Wires

6. Breadboard

Stresscounter %281%29
Show Advanced Options

Reflections

Pre-Demo Reflections:

We installed the Feel-o-Meter in the studio about a day before the day of our project demonstration, in order to collect data the cohorts feelings and also to test it in the real-life context. 

  1. We collected over 80 responses throughout the day. These responses were quite varied since a lot of our batchmates were just trying out the product by pressing buttons. But it also led us to the question of the presence of the device after the initial excitement wears off. Will it be able to capture true data?
  2. We also realized that many times people would just hit the button and leave while their responses were not captured. To address this we added a small illustration that prompted the users to "Push - Breath - Release and then let the lights breath back". This not only helped us trigger the right usage but also create a need for the users to stop and analyze their true feelings before pressing the button.


Post-Demo Reflections:

We got some really insightful feedback and comments from our guests. It was wonderful to meet and exhibit our projects to people with a wide variety of interests and background. 

  1. One really nice idea was to implement a feature to calculate the change in mood/emotional state/ feelings expressed. This would help us capture the change in mood a particular event has triggered. For example, people can express their emotional state before the start of the class and then at the end of the class, helping us capture the variation as a true measure of the impact of the class on the emotional state
  2. One recurrent feedback was on the flexibility to change the prompt we had used, "How are you feeling today?". Our vision is to evolve Feel-o-Meter into a device that can be used in multiple different contexts and so in the future versions, we could include a small LED screen that could be customized to display different prompts on the basis of the context.
  3. One very interesting question was regarding "what happens to the isolated feelings." Since we are displaying the aggregated data of the feelings - does that impact the people who have isolated feelings. For example - if the entire cohort is happy would that impact me in voicing out that I am sad? If the entire cohort is stressed, would it trigger stress in me as well? Also, the other aspect of this is: would my voice be lost in since the data is an aggregate?
  4. A couple of guests asked us about how projects are utilizing our data and whether we agree with their usage? That led us to a bigger question on the control of data and its utilization that the developers of the IoT devices have. In the real world context, it would lead to a lot of safeguarding and creating ecosystems that are interconnected but also restricted. Does this indicate, can the internet of things truly be a full scope internet with free movement of data and information?
Drop files here or click to select

You can upload files of up to 20MB using this form.