49713 Designing for the Internet of Things
· 18 members
A hands-on introductory course exploring the Internet of Things and connected product experiences.
Inspired by the disconnect between students and educators, we created Feel-o-Meter, an interactive device to provide an alternate method for feedback. Understanding that in many classrooms or work environments, some people do not feel comfortable expressing their feelings or that feedback is often shared when it’s too late. We hope to share essential information with the right people, when it matters the most.
Inspired by the disconnect between students and educators, we created Feel-o-Meter to provide an alternate method for feedback. We noticed or have experienced that in many classrooms or work environments, some people do not feel comfortable expressing their feelings or that feedback is often shared when it’s too late.
With Feel-o-Meter, we hope to bridge that gap and share essential information with the right people, when it matters the most.
Feel-o-Meter is an interactive feedback device designed to help people express how they are feeling. This idea has proven successful by HappyOrNot (https://www.happy-or-not.com/en/) , a Finnish company that makes these customer satisfaction measurement terminals. While the mechanism is simple, it has proven the be impactful as the volume of data points is significantly higher than any other form of customer satisfaction survey.
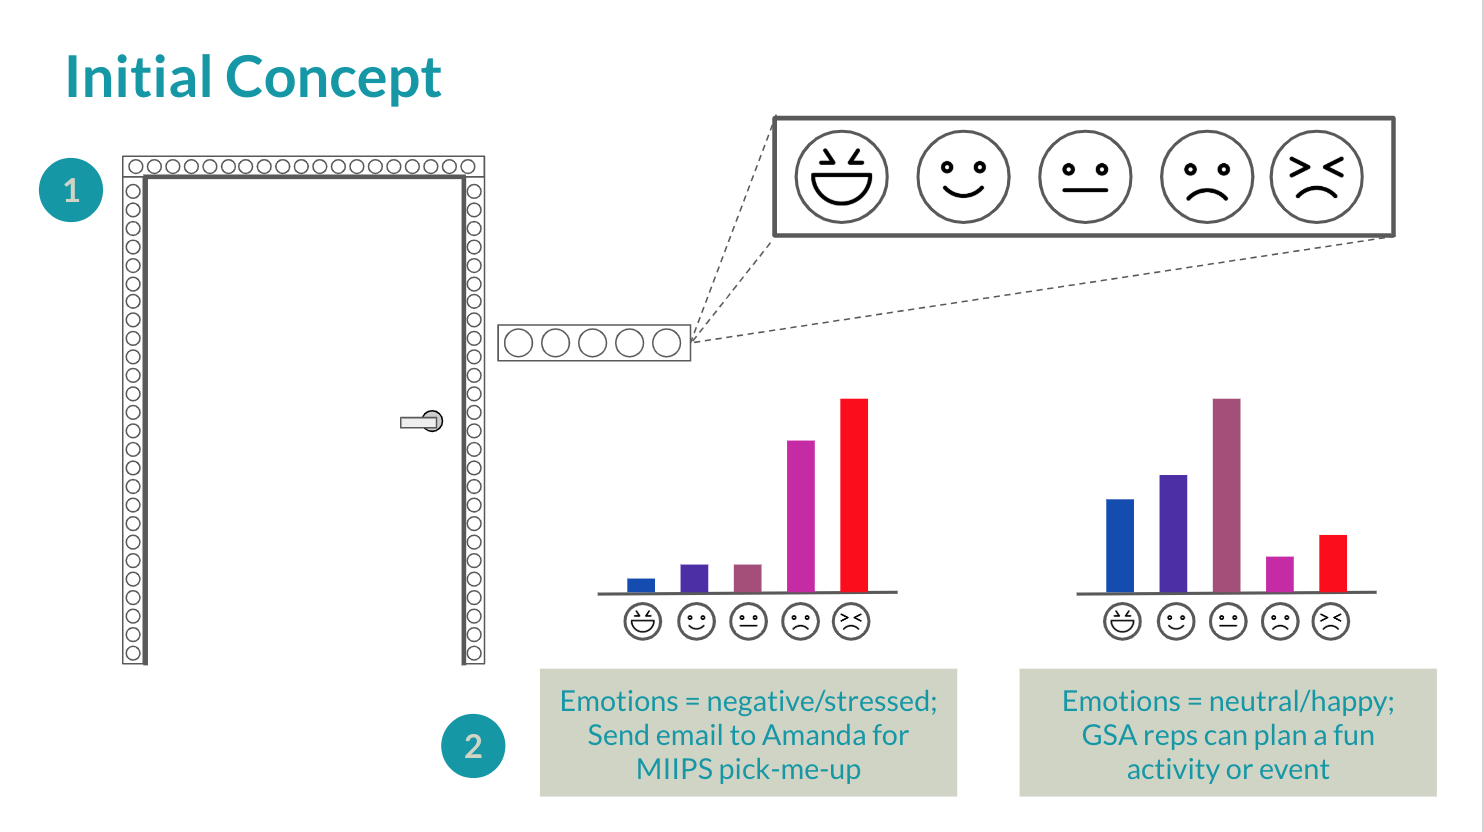
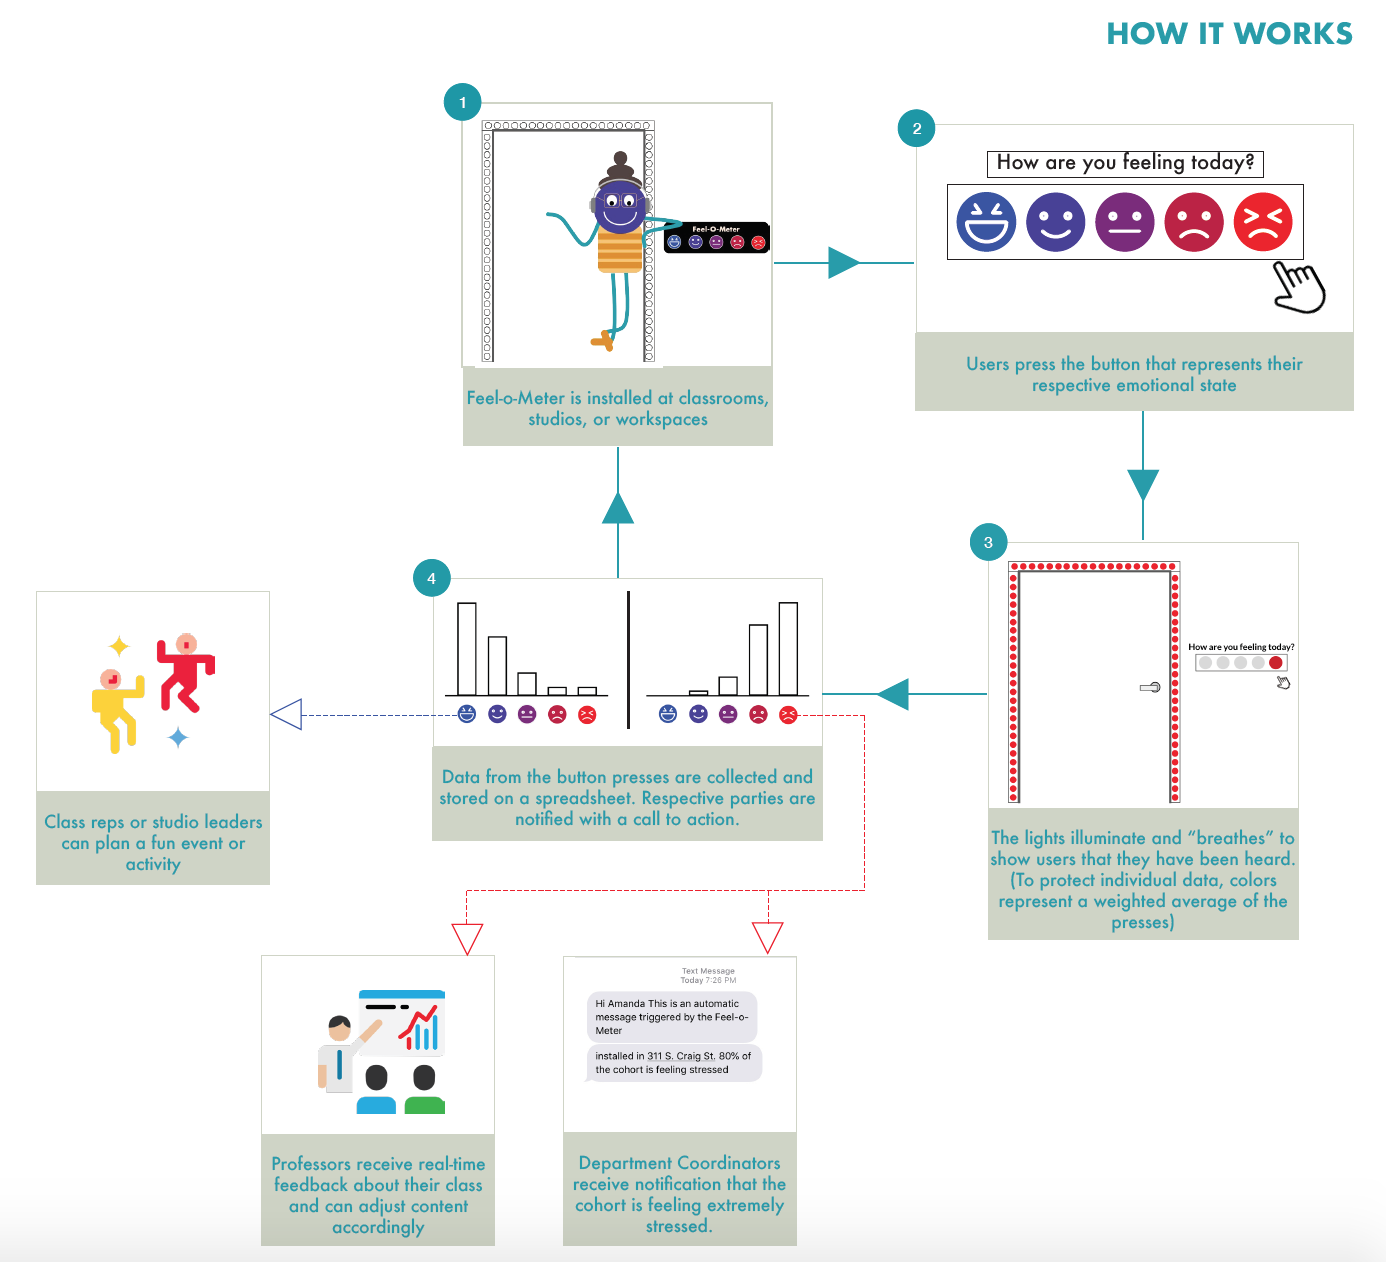
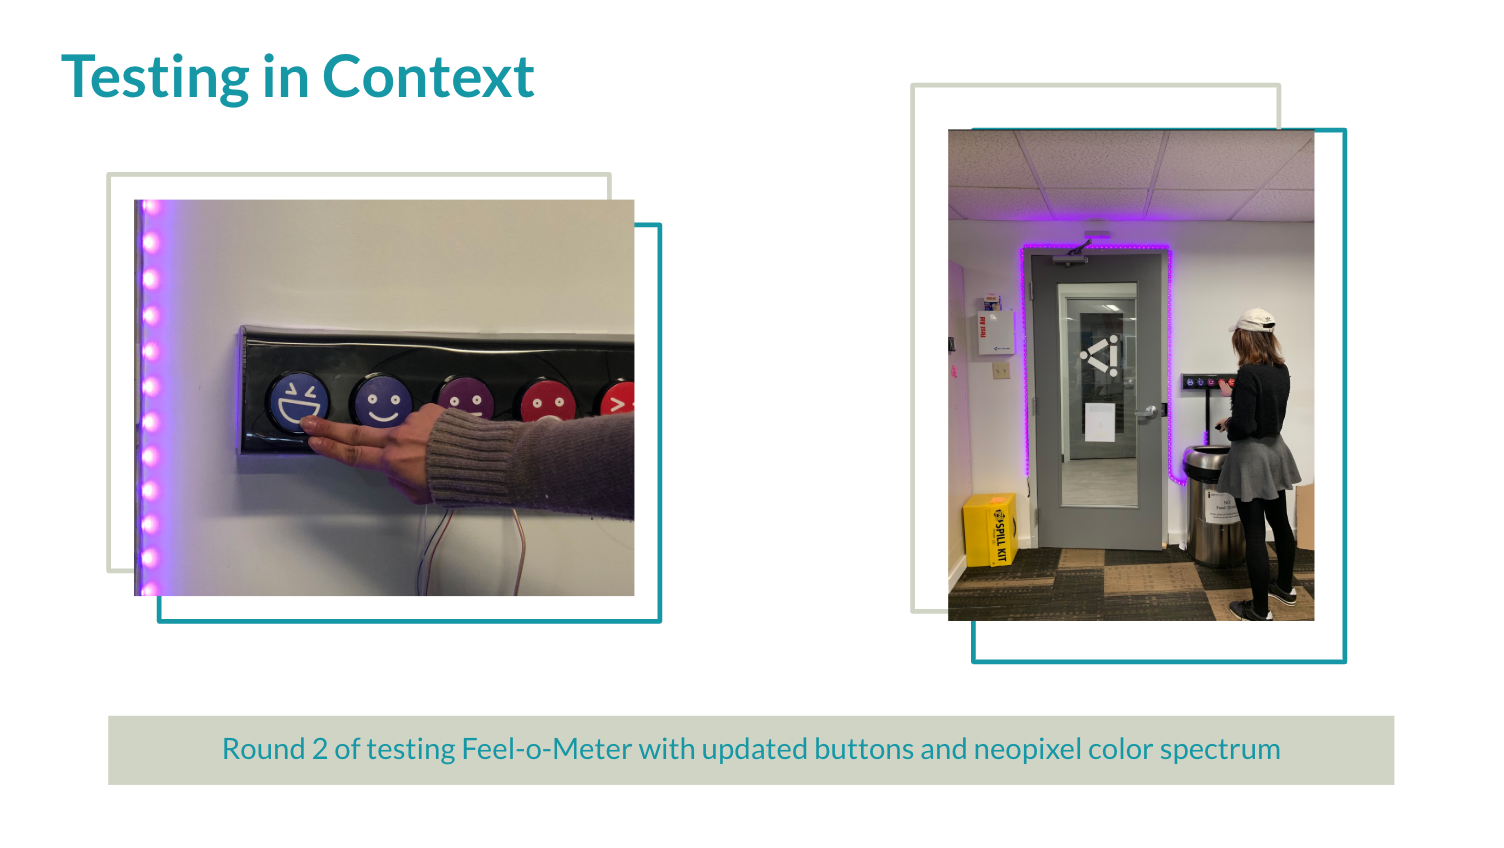
Our product has 5 buttons, each representing an emotional scale from Very Happy (Blue) to Very Sad/Frustrated (Red). The device would be installed by the exit of classrooms/studios with a neopixel strip bordering the nearby door. When a button is pressed, the lights illuminate to signal that a person’s feelings have been heard; and the color of the lights represent the average emotion of all the presses. This helps to protect an individual’s feelings, while showcasing how the group is feeling as a whole.
Give Feel-o-Meter a push, take a breath, release... and watch the lights breathe back.
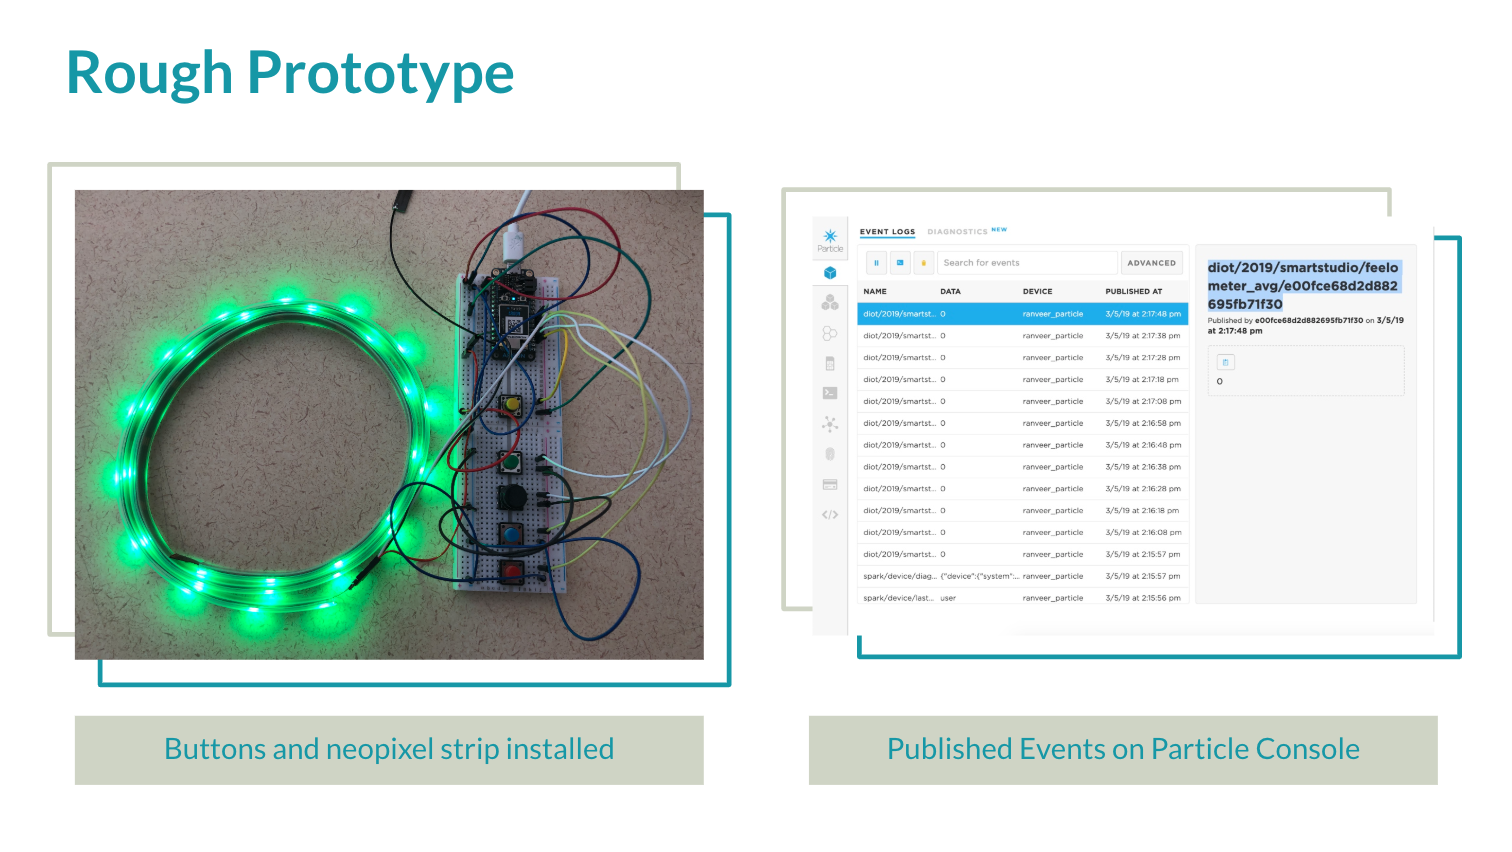
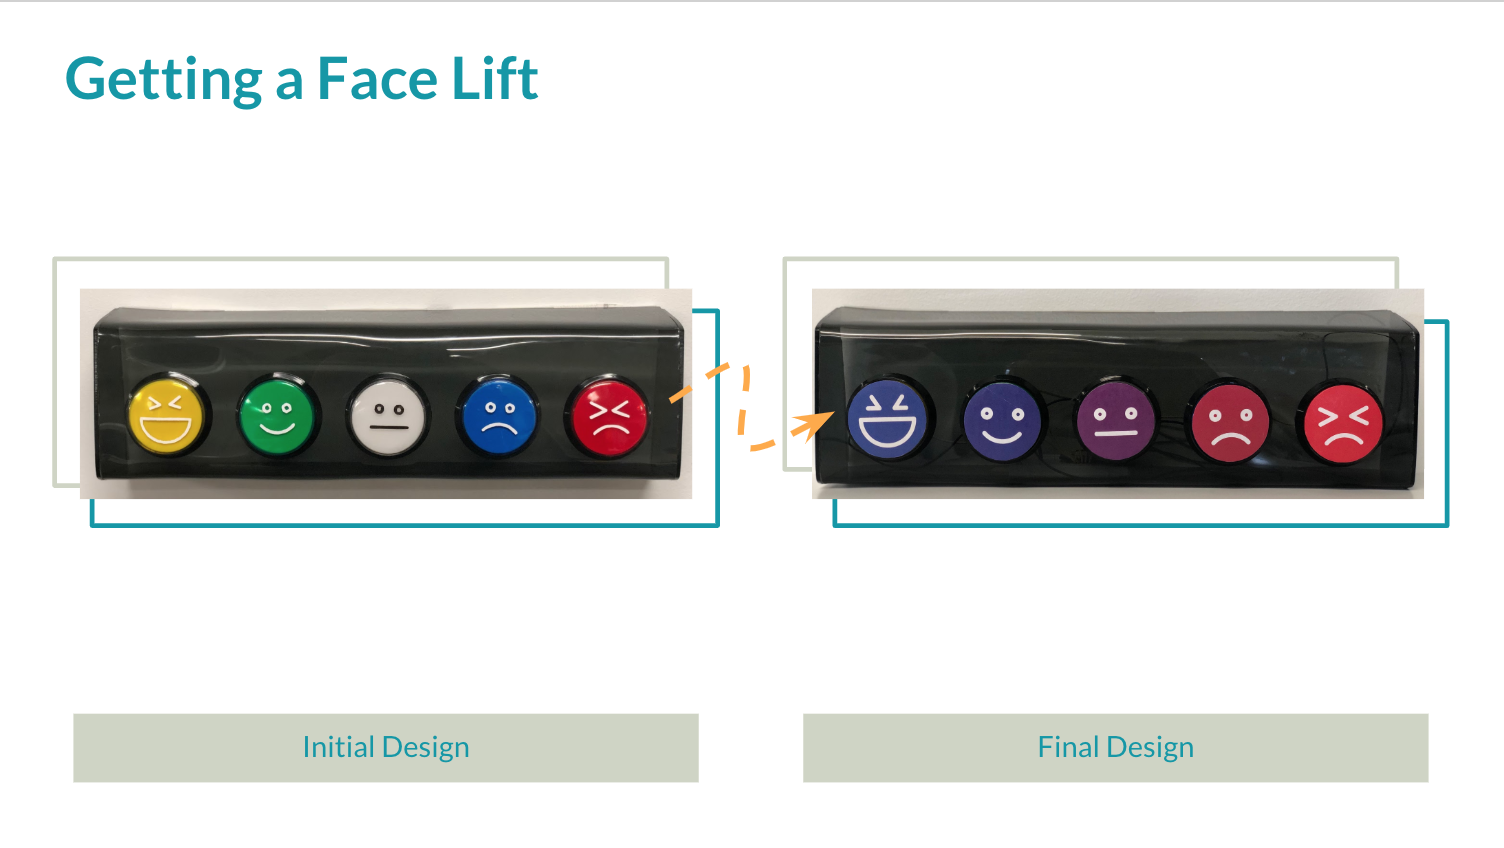
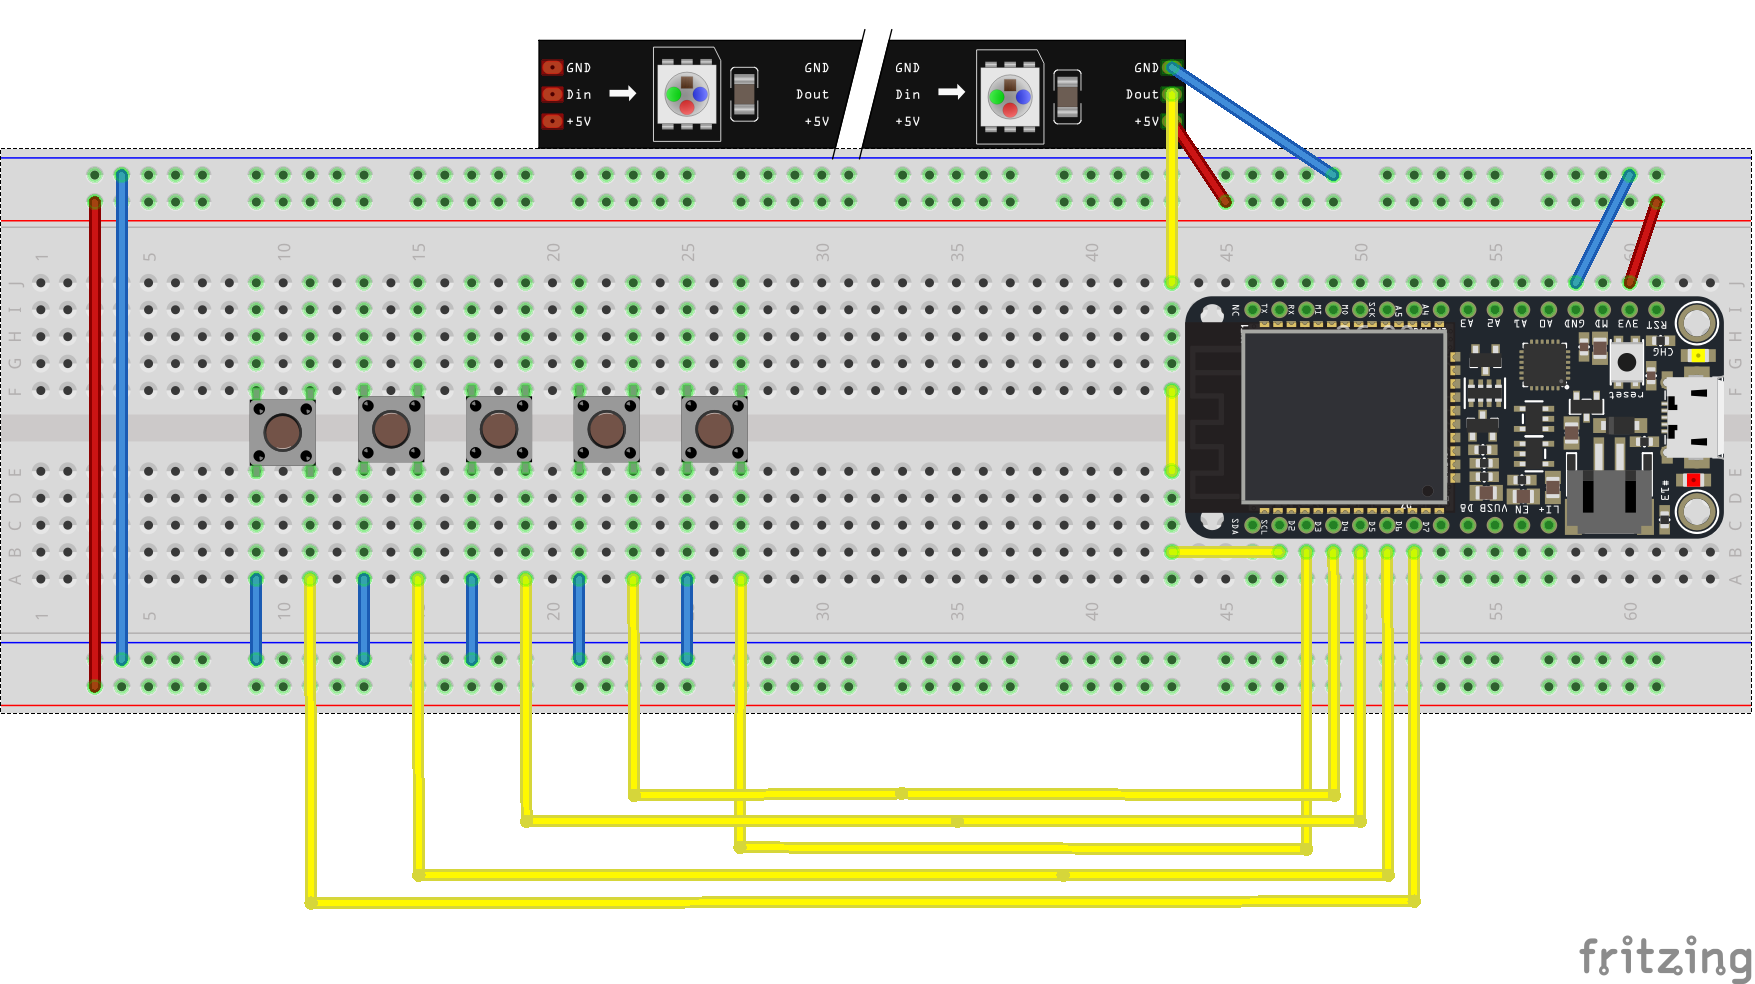
To bring our initial concept to life, our first step involved installing 5 push buttons and a neopixel strip that would illuminate with a color corresponding to the color of the push buttons. The emotional scale and color spectrum were as follows:
1. Very Happy/Excited – Yellow
2. Happy – Green
3. Neutral/"Meh" – White (note, the image above has a black button although the corresponding light was white)
4. Sad – Blue
5. Very Sad/Frustrated – Red
In addition, we used Particle.publish to share our event with other teams who were networking with us (using our outgoing data).
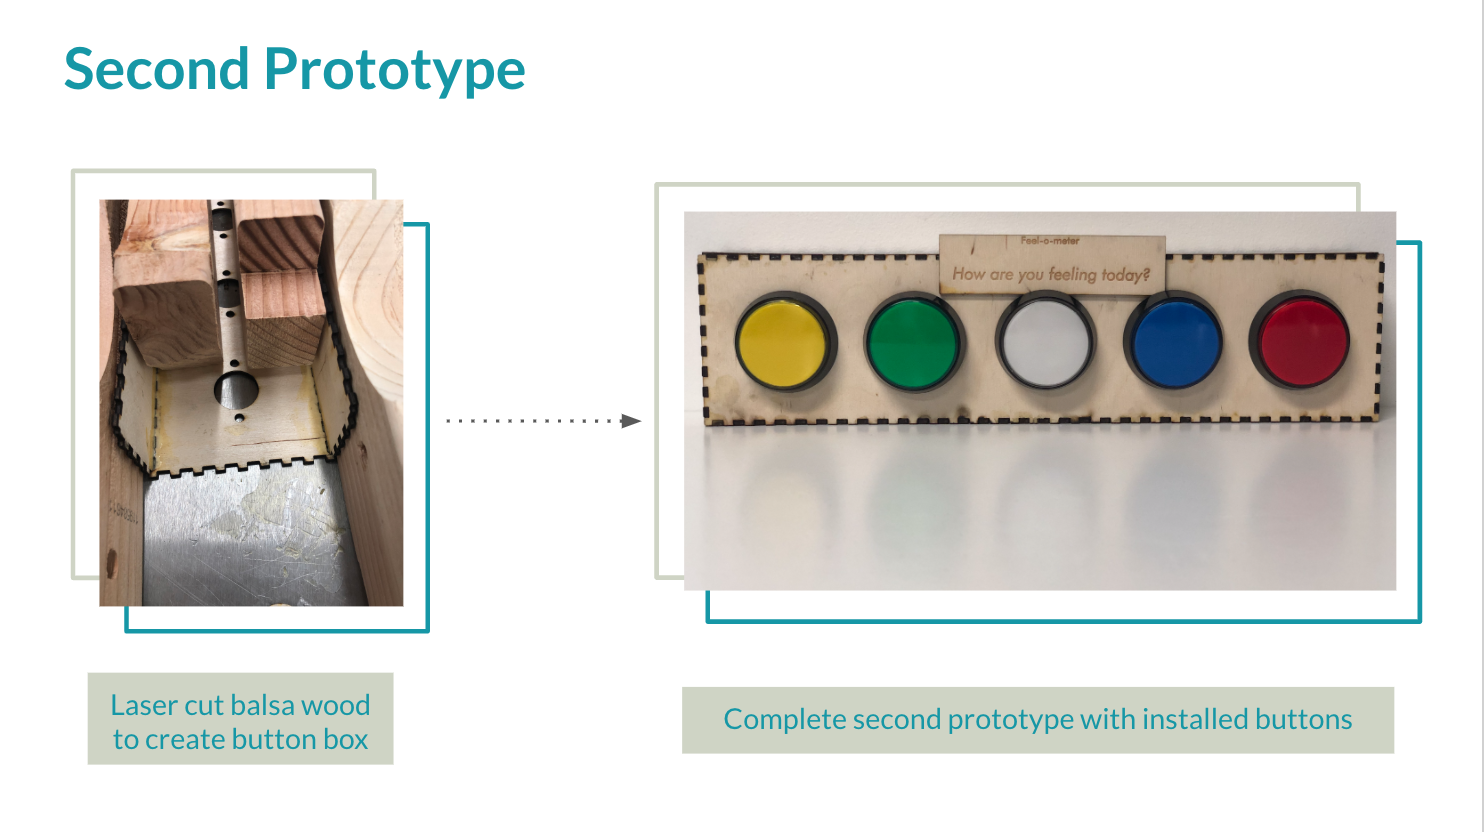
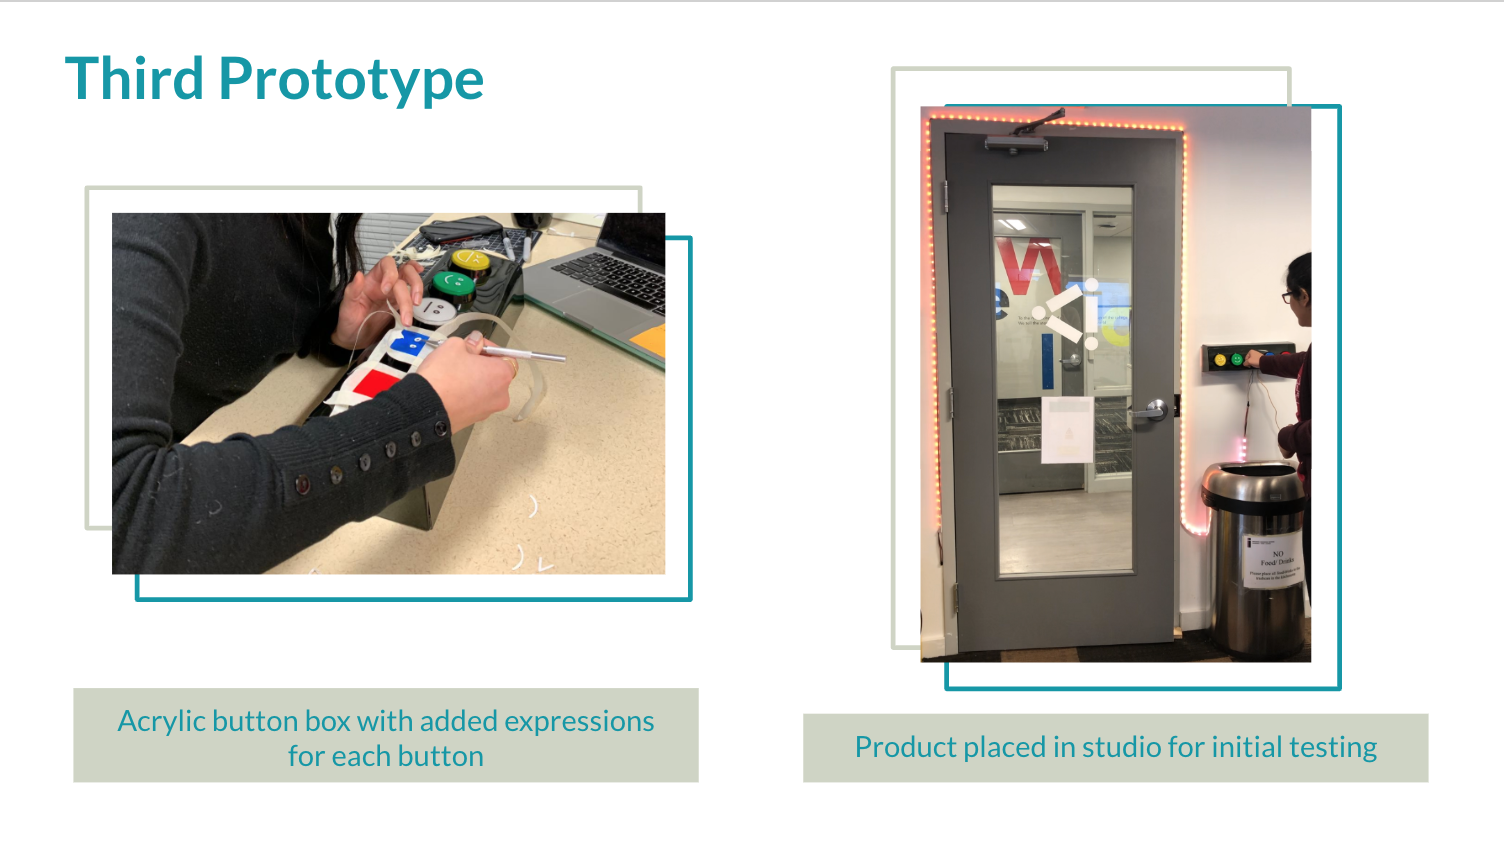
As we continued to build upon our concept, we built our first prototype by laser cutting and assembling pieces of balsa wood. We fitted and installed the arcade buttons and allowed users in the studio to provide feedback.
Overall, it was received positively, as the prototype seemed "approachable", "friendly", and "fun to press". During this stage, we also explored the placement and spacing of the components, sizing of the button box, and discussed what "feeling" we would like to communicate through our design elements. While we liked the "cuteness" of the balsa wood, we decided to elevate our aesthetic by creating a new button box with acrylic.
During this step, we decided to give Feel-o-Meter a "makeover". While we were originally using a step function to produce matching colors for our initial design (yellow, green, white, blue, and red), we decided to switch to a smoother color equation. This allowed us to produce a more ambient product, with a gradient from blue to red (representing Very Happy to Very Sad/Frustrated).
We connected with three other internet devices in the studio to provide them our data as inputs.
While similar products exist in other high traffic contexts (airports, public bathrooms, etc.), Feel-0-Meter differentiates itself from other devices by providing instant feedback to users when a button is pressed; the breathing lights around the doorway/exit comfort and confirm that their feelings are being heard. Additionally, Feel-o-Meter also triggers various calls-to-action (CTAs) tailored to specific contexts; for example, in class/studio settings, Department Coordinators receive a message when majority of the cohort is stressed.
Feel-o-Meter can be applied to other educational settings beyond universities, especially for grade levels where students may not be able to successfully articulate how they are feeling (K-12).
Additionally, Feel-o-Meter may also be useful at offices or workspaces to track employees' feelings and engagement.
//Date - 03/06/2019  - Feel-o-Meter. Contributors: Ranveer Katyal, Lama Al Flauji, and Shawn Koid
//Idea: The follwoing code was written to implement Feel-o-meter. Features:
//1. Stores the mood of the user through a button press
//2. Provides the feedback to the user through breathing neopixels
//3. Calculates the average mood of the cohort and lights up the neopixels in the gradient range  from Red(very stressed) to purple(neutral) to blue (very happy)
//4. The Particle device publishes: 1. the average mood data, 2. RGB Values of the neopixel
//5. Actions: 1. triggers an SMS to the admin if the 80% of the cohort is Sad or Very Sad; 2. Stores the avergae mood data changes in a Google Sheet

// This #include statement was automatically added by the Particle IDE.
#include <neopixel.h>

// IMPORTANT: Set pixel COUNT, PIN and TYPE
#define PIXEL_PIN D7
#define PIXEL_TYPE WS2812
#define PIXEL_COUNT 150

long lastPublishedAt = 0;

int publishAfter = 10000;

int pushVHappyButton = D2;
int pushHappyButton = D3;
int pushNeutralButton = D4;
int pushSadButton = D5;
int pushVSadButton = D6;

int    vHStateOld = HIGH;
int    HStateOld = HIGH;
int    NStateOld = HIGH;
int   sStateOld = HIGH;
int    vSStateOld = HIGH;
int feelState[5] = {0,0,0,0,0};
uint16_t i = 0;
uint32_t c;

int red[3] = {255,0,0};
int redPurple[3] = {187,0,62};
int purple[3] = {125,0,125};
int bluePurple[3] = {62,0,187};
int blue[3] = {0,0,255};
int Pxcolor[3];
int totalPress;
float feelAvg;
float lastAvg=0;
int totalStressCount;
int emailFlag = 0;

String moodColor;

Adafruit_NeoPixel strip = Adafruit_NeoPixel(PIXEL_COUNT, PIXEL_PIN, PIXEL_TYPE);
String sharedEventName = "diot/2019/smartstudio/";

String drivePublishEvent = "feelometer_drive/";
String emailPublishEvent = "feelometer_email/";

void setup() {
    Particle.subscribe(  sharedEventName , handleSharedEvent );
    pinMode(pushVHappyButton, INPUT_PULLUP);
    pinMode(pushHappyButton, INPUT_PULLUP);
    pinMode(pushNeutralButton, INPUT_PULLUP);
    pinMode(pushSadButton, INPUT_PULLUP);
    pinMode(pushVSadButton, INPUT_PULLUP);
    strip.begin();
    strip.show(); // Initialize all pixels to 'off'
}

void loop() {

    int vHState = digitalRead(pushVHappyButton);
    int HState = digitalRead(pushHappyButton);
    int NState = digitalRead(pushNeutralButton);
    int sState = digitalRead(pushSadButton);
    int vSState = digitalRead(pushVSadButton);

//Detect which button was pressed

    if (vHState != vHStateOld){
        if(vHState == LOW){
            feelState[0] = feelState[0] + 1; //updates the count of the feeling state
            pixelBreath(c);
            delay(50);
        }
        else{
            vHState = HIGH;
        }

    } else if (HState != HStateOld){
        if(HState == LOW){
            feelState[1] = feelState[1] + 1; //updates the count of the feeling state
            pixelBreath(c);
            delay(50);
        }
        else{
            HState = HIGH;
        }

    } else if (NState != NStateOld){
        if(NState == LOW){
            feelState[2] = feelState[2] + 1; //updates the count of the feeling state
            pixelBreath(c);
            delay(50);
        }
        else{
            NState = HIGH;
        }

    }else if (sState != sStateOld){
        if(sState == LOW){
            feelState[3] = feelState[3] + 1; //updates the count of the feeling state
            pixelBreath(c);
            delay(50);
        }
        else{
            sState = HIGH;
        }

    } else if (vSState != vSStateOld){
        if(vSState == LOW){
            feelState[4] = feelState[4] + 1; //updates the count of the feeling state
            pixelBreath(c);
            delay(50);
        }
        else{
            sState = HIGH;
        }

    }

    vHStateOld = vHState;
    HStateOld = HState;
    NStateOld = NState;
    sStateOld = sState;
    vSStateOld = vSState;

    //calculate the weighted average to determine the average mood
    lastAvg = feelAvg;

    feelAvg = ((1*feelState[0]) + (2*feelState[1])+ (3*feelState[2]) + (4*feelState[3]) + (5*feelState[4]))/(feelState[0]+feelState[1]+feelState[2]+feelState[3]+feelState[4]);


   //calculate the gradient hue RGB values scaled based on the average mood for neopixel
    Pxcolor[0]=(blue[0]*feelState[0]+bluePurple[0]*feelState[1]+purple[0]*feelState[2]+redPurple[0]*feelState[3]+red[0]*feelState[4])/(feelState[0]+feelState[1]+feelState[2]+feelState[3]+feelState[4]);
    Pxcolor[1]=(blue[1]*feelState[0]+bluePurple[1]*feelState[1]+purple[1]*feelState[2]+redPurple[1]*feelState[3]+red[1]*feelState[4])/(feelState[0]+feelState[1]+feelState[2]+feelState[3]+feelState[4]);
    Pxcolor[2]=(blue[2]*feelState[0]+bluePurple[2]*feelState[1]+purple[2]*feelState[2]+redPurple[2]*feelState[3]+red[2]*feelState[4])/(feelState[0]+feelState[1]+feelState[2]+feelState[3]+feelState[4]);

    //light up neopixel
    c=strip.Color(Pxcolor[0], Pxcolor[1], Pxcolor[2]);
    strip.show();
    delay( 50 );

    totalPress = (feelState[0]+feelState[1]+feelState[2]+feelState[3]+feelState[4]);

    //Publish event to trigger SMS if 80% of class is feeling Sad or Very sad
    totalStressCount = feelState[3]+feelState[4];

    if(totalStressCount>10 && emailFlag!=1){
        publishEmail( String(totalStressCount));
        emailFlag=1;
    }

    //Reset counters after 50 preses
    if(totalPress>50){
        feelState[0] = 0;
        feelState[1] = 0;
        feelState[2] = 0;
        feelState[3] = 0;
        feelState[4] = 0;
        emailFlag=0;
    }

    //publish RGB values of the neo pixel
   moodColor = "R"+ String(Pxcolor[0]) + "G" + String(Pxcolor[1]) + "B" + String(Pxcolor[2]);

   publishMyEvent(String(feelAvg), moodColor);

   if (feelAvg != lastAvg)
   publishDriveEvent(String(feelAvg));
   delay(500);

}

void publishMyEvent(String avgMood, String pxMoodColor)
{
  // Remember that a device can publish at rate of about 1 event/sec,
  // with bursts of up to 4 allowed in 1 second.
  // Back to back burst of 4 messages will take 4 seconds to recover.
  // So we want to limit the amount of publish events that happen.

  // check that it's been 10 secondds since our last publish
  if( lastPublishedAt + publishAfter < millis() )
  {
      // Remember our subscribe is matching  "db2018/paired/"
      // We'll append the device id to get more specific
      // about where the event came from

      // System.deviceID() provides an easy way to extract the device
      // ID of your device. It returns a String object of the device ID,
      // which is used to identify your device.
      // This will build 'diot/2019/smartstudio/myEvent/A13231245345A078'

      String eventName = sharedEventName + "feelometer_avg/" + System.deviceID();
      String eventNamePxColor = sharedEventName + "feelometer_PxColor/" + System.deviceID();

      // now we have something like "diot/2019/paired/0123456789abcdef"
      // and that corresponds to this devices info

      // then we share it out
      Particle.publish( eventName, avgMood );

      // And this will get shared out to all devices using this code
    Particle.publish( eventNamePxColor, pxMoodColor );
      // we just pubished so capture this.
      lastPublishedAt = millis();
  }

}

void publishDriveEvent( String avgMood)
{


  // Remember that a device can publish at rate of about 1 event/sec,
  // with bursts of up to 4 allowed in 1 second.
  // Back to back burst of 4 messages will take 4 seconds to recover.
  // So we want to limit the amount of publish events that happen.

      // Remember our subscribe is matching  "db2018/paired/"
      // We'll append the device id to get more specific
      // about where the event came from

      // System.deviceID() provides an easy way to extract the device
      // ID of your device. It returns a String object of the device ID,
      // which is used to identify your device.
      // This will build 'diot/2019/smartstudio/myEvent/A13231245345A078'

      String eventName = sharedEventName + drivePublishEvent + System.deviceID();

      // now we have something like "diot/2019/paired/0123456789abcdef"
      // and that corresponds to this devices info

      // then we share it out
      Particle.publish( eventName, avgMood  );

      // And this will get shared out to all devices using this code

      // we just pubished so capture this.
      //lastPublishedAt = millis();


}

void publishEmail( String totalStressC)
{


  // Remember that a device can publish at rate of about 1 event/sec,
  // with bursts of up to 4 allowed in 1 second.
  // Back to back burst of 4 messages will take 4 seconds to recover.
  // So we want to limit the amount of publish events that happen.

      // Remember our subscribe is matching  "db2018/paired/"
      // We'll append the device id to get more specific
      // about where the event came from

      // System.deviceID() provides an easy way to extract the device
      // ID of your device. It returns a String object of the device ID,
      // which is used to identify your device.
      // This will build 'diot/2019/smartstudio/myEvent/A13231245345A078'

      String eventName = sharedEventName + emailPublishEvent + System.deviceID();

      // now we have something like "diot/2019/paired/0123456789abcdef"
      // and that corresponds to this devices info

      // then we share it out
      Particle.publish( eventName, "Email Sent & " + totalStressC);

      // And this will get shared out to all devices using this code

      // we just pubished so capture this.
      //lastPublishedAt = millis();
}

void handleSharedEvent(const char *event, const char *data)
{
    String eventName = String( event ); // convert to a string object
    String deviceID = System.deviceID();

    if( eventName.indexOf( deviceID ) != -1 ){
      return;
    } else {
        //pixelLit(count); // Lights up the Pixel sent byt the other device

    }

}
//for the breathing feedback of neopixel

void pixelBreath(int c){
    for(int j=0;j<3;j++){
        for(int i=0;i<strip.numPixels();i++){
        strip.setPixelColor(i, 0,0,0 );
        }
        strip.show();
        delay(150);

        for(int k=0;k<strip.numPixels();k++){
        strip.setPixelColor(k, c );
        }
        strip.show();
        delay(150);
    }
}Pre-Demo Reflections:
We installed the Feel-o-Meter in the studio about a day before the day of our project demonstration, in order to collect data the cohorts feelings and also to test it in the real-life context.
Post-Demo Reflections:
We got some really insightful feedback and comments from our guests. It was wonderful to meet and exhibit our projects to people with a wide variety of interests and background.
A hands-on introductory course exploring the Internet of Things and connected product experiences.
Inspired by the disconnect between students and educators, we created Feel-o-Meter, an interactive device to provide an alternate method for feedback. Understanding that in many classrooms or work environments, some people do not feel comfortable expressing their feelings or that feedback is often shared when it’s too late.
We hope to share essential information with the right people, when it matters the most.
March 5th, 2019